Business Intelligence (BI) Dashboard Services
At Primalcom, we assist organizations in realizing the complete potential of their data through our extensive Business Intelligence (BI) dashboard services. In the current dynamic landscape, the ability to make informed decisions is essential for maintaining a competitive edge. BI dashboards act as effective instruments that aggregate data from multiple sources, converting it into actionable insights. Our skilled team at Primalcom is committed to enabling you to utilize top-tier BI tools, including Power BI, Tableau, Redash, Superset, and Grafana, to transform your raw data into visual narratives that propel strategic business results.


Why BI Dashboards Matter
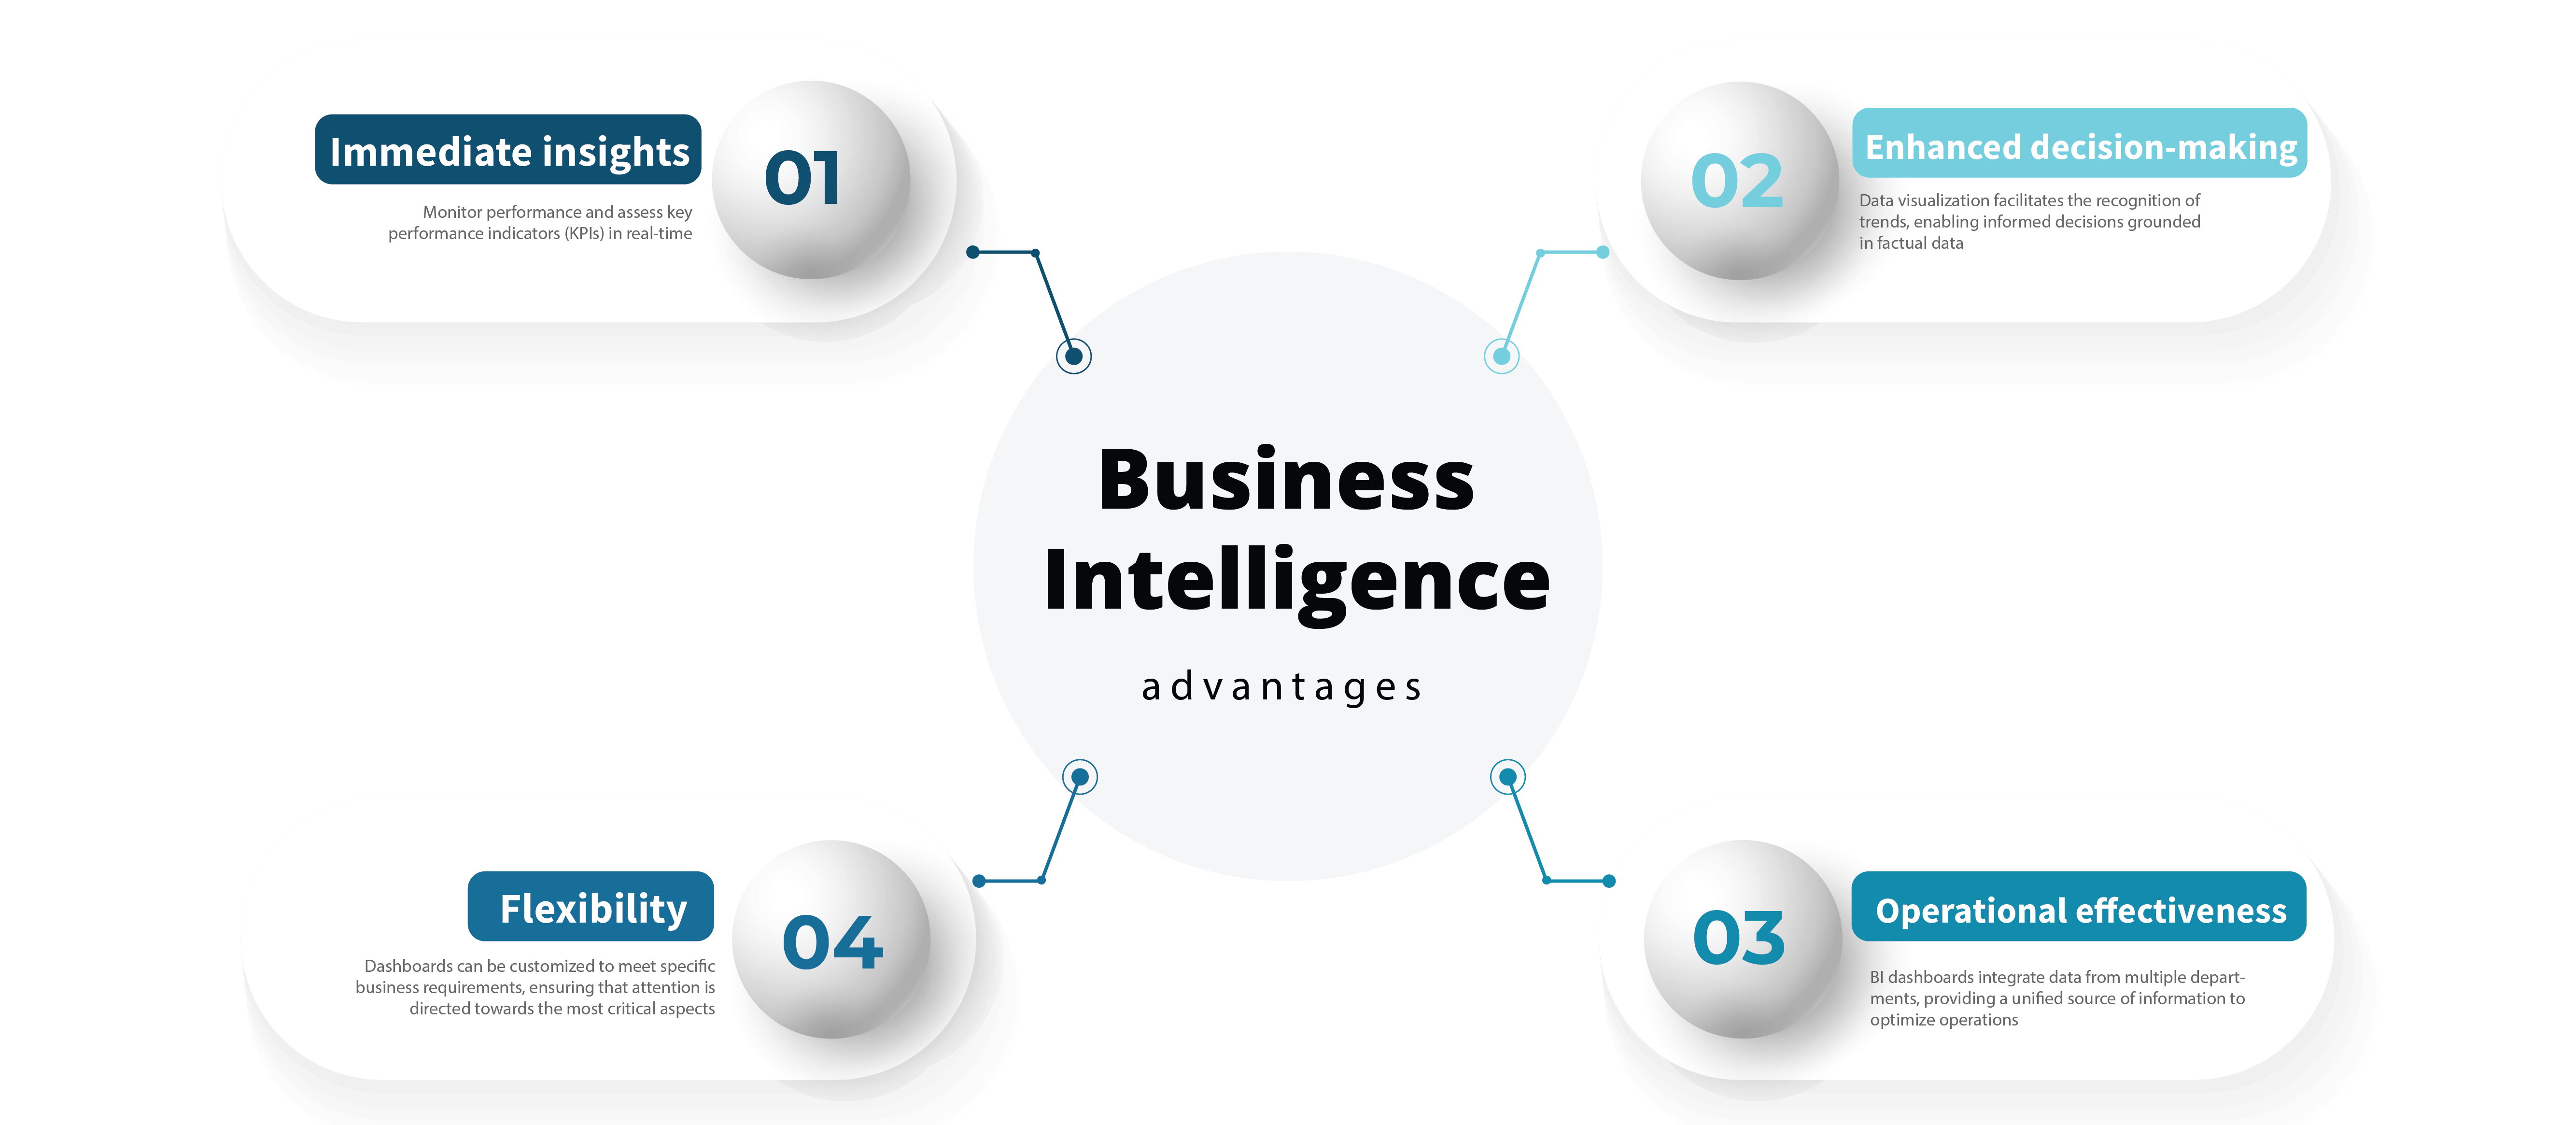
As data continues to play a crucial role in business functions, the capacity to visualize and analyze this information is essential for achieving success. Business Intelligence (BI) dashboards offer the following advantages:

Immediate insights
Monitor performance and assess key performance indicators (KPIs) in real-time.
Enhanced decision-making
Data visualization facilitates the recognition of trends, enabling informed decisions grounded in factual data.
Operational effectiveness
BI dashboards integrate data from multiple departments, providing a unified source of information to optimize operations.
Flexibility
Dashboards can be customized to meet specific business requirements, ensuring that attention is directed towards the most critical aspects.
Common Challenges in Business Intelligence (BI) Dashboard Development
Inaccurate or inconsistent information can result in erroneous conclusions.
Merging data from multiple sources frequently leads to
compatibility problems.
Employees may be reluctant
Dashboards that load slowly can obstruct timely decision-making.
Dashboards that fail to address particular business requirements may reduce their overall effectiveness.
Primalcom’s BI Dashboard Services
At Primalcom, we provide customized business intelligence dashboard solutions utilizing some of the most advanced tools available in the market, each chosen to address a variety of business needs. Whether your goal is to boost operational efficiency, improve decision-making processes, or gain deeper insights into customer behavior, we have the appropriate solution for you.

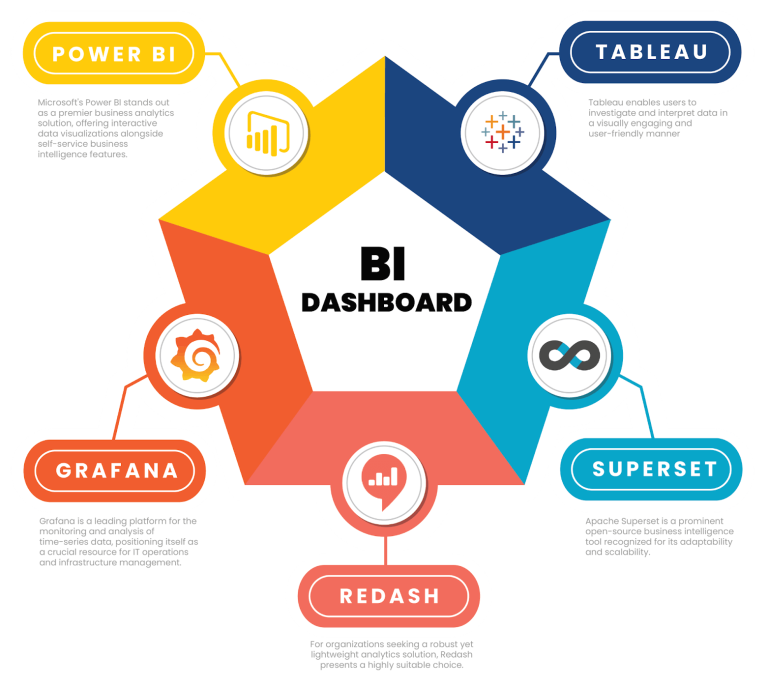
Microsoft’s Power BI stands out as a premier business analytics solution, offering interactive data visualizations alongside self-service business intelligence features. This tool empowers users to develop and disseminate dashboards and reports in real-time. Power BI is particularly advantageous for organizations that utilize Microsoft products, facilitating smooth integration with Excel, Azure, and Office 365. Primalcom specializes in crafting tailored Power BI dashboards that provide clear reports and insights, enhancing your decision-making capabilities.
For organizations seeking a robust yet lightweight analytics solution, Redash presents a highly suitable choice. This open-source platform is specifically crafted to enhance data visualization for teams while accommodating SQL-based queries. It is particularly beneficial for companies that aim to visualize data derived from intricate SQL queries without necessitating significant technical knowledge. Primalcom offers comprehensive support for the deployment of Redash, covering everything from initial setup to dashboard design, thereby ensuring that you obtain the necessary insights with ease.
Apache Superset is a prominent open-source business intelligence tool recognized for its adaptability and scalability. This platform enables organizations to analyze extensive datasets efficiently while ensuring optimal performance. Its user-friendly interface and a wide array of visualization capabilities render it an ideal choice for large enterprises seeking a scalable and economical BI solution. At Primalcom, we are committed to tailoring Superset to meet your specific requirements, delivering aesthetically pleasing and functional dashboards for your teams.
Grafana is a leading platform for the monitoring and analysis of time-series data, positioning itself as a crucial resource for IT operations and infrastructure management. Its capacity to visualize metrics from a diverse array of data sources, including Prometheus and Elasticsearch, has made it particularly popular among DevOps teams. At Primalcom, we empower you to fully utilize Grafana’s features, delivering actionable insights that assist in monitoring system health, performance, and additional metrics.
Why Choose Primalcom?
At Primalcom, we bring years of experience in BI dashboard development, helping businesses extract maximum value from their data. Our services include:
End-to-end support
We guarantee that your Business Intelligence solution remains in harmony with your objectives, from the initial consultation through to deployment and continuous maintenance.
Custom dashboard development
We customize each dashboard to meet the unique requirements of your business.
Expertise across industries
Our team possesses extensive experience in providing Business Intelligence solutions across various industries, allowing us to comprehend the distinct challenges that your organization encounters.
Commitment to innovation
We maintain a leading position by utilizing the most advanced BI technologies, guaranteeing that your business reaps the advantages of state-of-the-art solutions.
Leverage the capabilities of your data with Primalcom’s comprehensive BI dashboard services, empowering your team to make well-informed, data-driven decisions. Reach out to us to explore how we can transform your business with intuitive and powerful BI dashboards.
Frequently Asked Questions
A BI dashboard serves as a visualization tool that aggregates data from multiple sources, offering real-time actionable insights to facilitate informed decision-making.
Primalcom utilizes Power BI, Tableau, Redash, Superset, and Grafana to create tailored dashboards for its clients.
These dashboards enhance decision-making processes, boost operational efficiency, and provide immediate data insights across various departments.
Indeed, Primalcom provides customization options for BI dashboards to align with the unique requirements of each business.
Case Studies
01
Closed-loop payment system at bazaar improves experience, security, and operations, setting blueprint for future events.
02
Global sports brand partnered with e-commerce enabler, Primalcom, for Southeast Asia expansion, achieving growth and efficiency.
03
Iconic skyscraper integrates Intelligent Washroom Solution, enhancing hygiene, efficiency, sustainability, and user satisfaction.
Request a Free Demo Today
Discover how Primalcom’s advanced Business Intelligence (BI) Dashboard can revolutionize your data analysis and decision-making processes. Request a free demo today to see how our BI solution can increase efficiency, reduce costs, and transform your business into a data-driven organization.
Get Started Now and see why businesses worldwide trust Primalcom’s BI Dashboard for all their data visualization and reporting needs.


